2017年8月万事达卡财新BBD中国新经济指数发布

一、指数概览
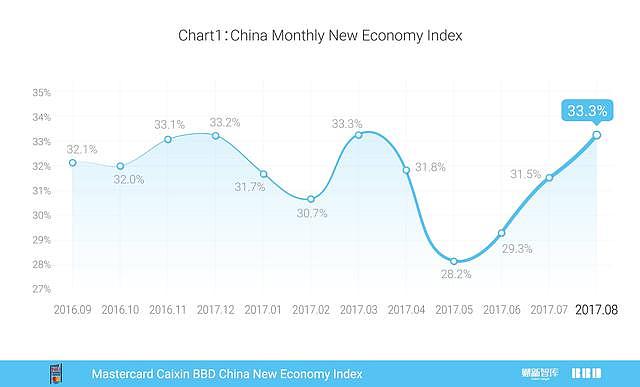
2017年8月,万事达卡财新BBD中国新经济指数(NEI)录得33.3,即新经济投入占整个经济投入的比重为33.3%。按可比口径计算,本月NEI比上月上升1.8个百分点,指数回升到2017年3月的水平,达到近一年指数的最高值(图1)。本月NEI的上升主要来自资本的大幅增长。
NEI新经济据于以下定义:首先,高人力资本投入、高科技投入、轻资产。其次,可持续的较快增长。第三,符合产业发展方向。NEI所含行业详见《万事达卡财新BBD中国新经济指数技术报告》与《万事达卡财新BBD中国新经济指数报告(2017年3月)》。

二、主要分项指标
NEI包括劳动力、资本和科技三项一级指标,它们在NEI中的权重分别是40%、35%和25%。2017年8月NEI的上升来自资本投入的提高。本月资本投入指数上升最快,从2017年7月的32.7上升为38.9,上升6.2。劳动力投入指数与7月持平,本月同样为30.3。科技投入指数在近半年波动较大,在经过连续两个月的连续上升后,8月略微下降,本月科技投入指数录得30.2(图2)。


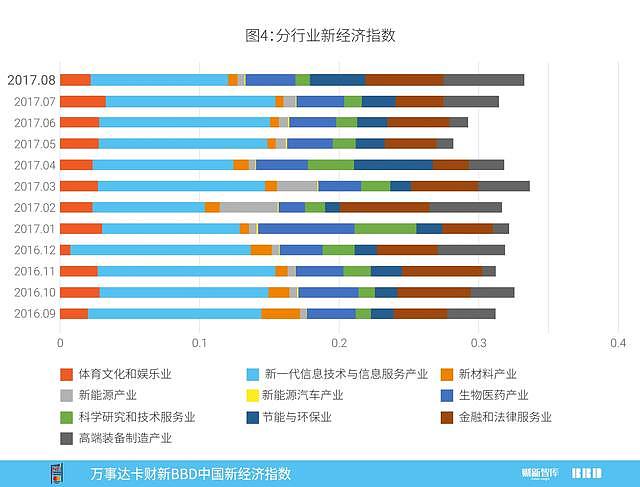
分行业看,NEI中占比最大的行业为新一代信息技术与信息服务产业,2017年8月为总指数贡献了9.8个百分点;高端装备制造产业贡献了5.8个百分点,排名第二,是2016年来贡献率最高的一次;金融和法律服务业贡献排名第三,本月贡献5.6个百分点(图4)。
三、新经济就业
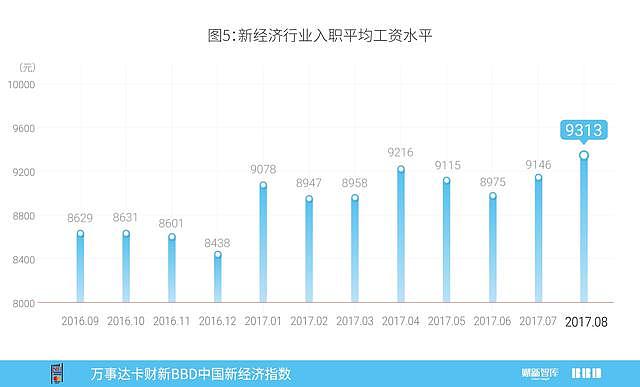
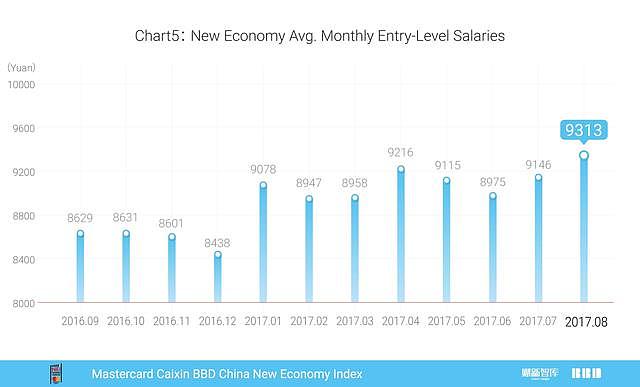
2017年8月,新经济行业入职平均工资水平比上月略微上升,为每月9313元,较上月增长167元(图5)。新经济工资主要来自51job、智联招聘、拉钩、赶集网等数个招聘网站的招聘信息,即对劳动力的需求工资。
2017年8月新经济行业招聘人数占全国总招聘人数比例有所上升,从29.2%上升为29.4%,同时新经济行业招聘总薪酬占全国总薪酬比重略有下降,从31.4%下降至31.1%,这意味着新经济行业的平均入职工资水平相对于全国平均入职工资水平保持稳定。2017年8月新经济入职工资“溢价”为6.0%,低于上月1.6%(图6)。2017年以来,新经济行业的平均工资溢价连续三个月稳步上升后本月有小幅下降,但溢价仍高于5%。

四、新增公司占比情况
使用新增企业数据,我们可以对各行业新增企业占总新增企业比重进行监测,见图7。

排名上升的行业包括以下几类——建筑,从去年8月的第20名上升至2017年8月的第16名,占比上升18.1%;装饰,从去年8月的第8名上升至2017年8月的第7名,占比下降1.8%;农业,从去年8月的第23名上升至2017年8月的第21名,占比上升18.2%。部分传统行业的投资已经回温,这部分投资大多来自于政府。此外,部分轻资产行业的投资也出现了上升,文化行业从2016年8月的第25名上升至2017年8月的第8名,占比上升146.7%,是本月行业排名增长最快、占比增加最多的行业;咨询行业从2016年8月的第9名上升至2017年8月的第6名,占比上升10.2%;信息,从第12 名上升至第11 名,占比上升1.2%;网络科技,从第11名上升至第9名,占比上升9.2%。
排名下降的行业包括以下几类——投资,从2016年8月的第16名下降至2017年8月的第25名,占比下降28.2%,是本月排名下降最多的行业;电子商务,从2016年8月的第7名下降至2017年8月的第14名,占比下降48.7%;教育,从2016年8月的第6名下降至2017年8月的第13名,占比下降43.1%;传播,从2016年8月的第17名下降至2017年8月的第19名,占比下降5.7%;文化传媒,从2016年8月的第22 名下降至第23名,占比下降7.0%;劳务,从去年8月的第21名下降为第22名,占比下降10%。除此之外,房地产、建材行业的排名也有所下降,占比均下降16%左右。
五、从各大机场流量看经济活力
本月我们延续用机场流量分析方式对机场流量数据进行跨年度分析,比较的对象为2017年8月和2016年8月的各大机场流量数据。
首先,我们将2017年8月平均每天的人口净流入量减去2016年8月平均每天的人口净流入量,并按照两者差的绝对值进行排序,得到了净流入增加量最快城市与净流入减少量最快城市(图8)。

可以看到,净流入量增加最大的城市是北京、昆明、乌鲁木齐、广州和上海;北京、昆明、广州和上海保持了对人口吸引力上升势头,也显示了较好的经济活力;乌鲁木齐8月净流入量同比增长排名第三,这说明乌鲁木齐较去年同期在人口吸引力方面有所提升。
成都、昆明维持了2016年以来的强势人口吸引力,成为西南地区的亮点;深圳在航班净流入人口增加量上仍未能进入前十名。
在净流出量减少最多的城市中,武汉、长沙、桂林、贵阳和南京的净流出量相对较大;从侧面呈现出这些地区对人口的吸引力较同期有所下降。
六、从劳动力数据看投资复苏
本月,我们继续使用劳动力大数据对目前的投资进行分析,使用中国每月的房地产开发投资完成额当月值与劳动力数据建筑类就业人员的需求占比进行比较。在2017年7月的建筑类就业相关人员预测与实际稍有偏差,但整体趋势印证相对准确性,7月的建筑类就业人员占比为8.49%,环比上升0.59%,同时7月的房地产投资完成额当月值为9151亿元,低于6月的13015.3亿元,环比下降29.7%(图9)。
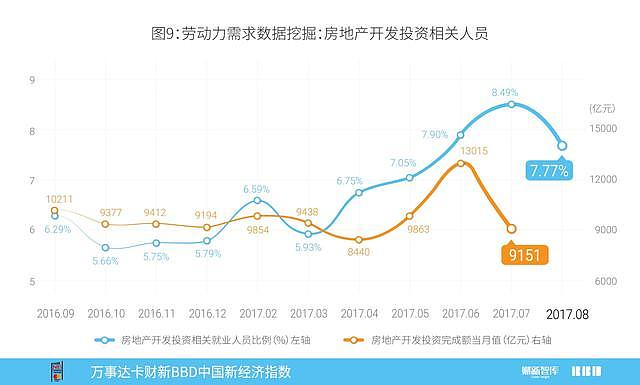
本月,建筑类劳动人员的需求有所下降,相关就业人员比例为7.77%,环比下降0.72%,考虑到该大数据指标在过去大部分时间段的准确性,我们预测下一个月的房地产投资数据会略微下降。
七、城市新经济排名
2017年8月新经济总量指数城市排名前20名如图10所示,上海、广州、杭州、北京、南京排名前五。该排序计算每个投入指标在所有城市中的排序百分位,再将百分位加权平均,体现的是近半年城市间新经济总量排名。
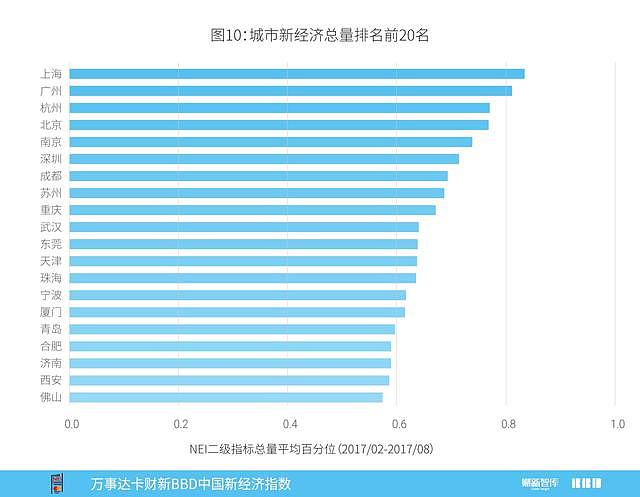
图11计算了2017年2月到2017年8月城市NEI平均排名,前五名为北京、上海、杭州、广州、南京。

更多咨询敬请联络:
万事达卡
公共关系副总裁 吴焕宇
电话:+86-10-8519-9304
财新智库
财新智库高级经济学家 王喆
电话:+86-10-8590-5019
公关总监 马玲
电话:+86-10-8590-5204
BBD(数联铭品)
BBD(数联铭品)首席经济学家 陈沁
电话:+86-28-6529-0823
版权声明
万事达卡财新BBD中国新经济指数,是由财新智库(深圳)投资发展有限公司和成都数联铭品科技公司共同研发,与北京大学国家发展研究院合作,经过近一年努力,于2016年3月2日在北京首发的指数产品,此后每月2日上午10:00发布上月数据。
关于万事达卡
万事达卡(纽交所股票交易代码:MA),www.mastercard.cn,是全球性的支付与科技公司。通过运营全球最快的支付处理网络,万事达卡将超过210个国家和地区的消费者、金融机构、商户、政府和企业连接在一起。万事达卡的产品和解决方案使得每个人在购物、旅行、企业经营、财务管理等日常商业活动都变得更容易、更安全和更高效。敬请关注我们的“万事达卡”官方微信以及在新浪的官方微博@万事达人,以获悉动态并参与互动。也可访问万事达卡新闻中心或万事达卡互动中心获取更多资讯。
关于财新
财新传媒是提供财经新闻的全媒体集团,依托专业的团队和强大的原创新闻优势,以网站、移动端、期刊、视频、图书、会议等 多层次的业务平台,为中国最具影响力的受众群,提供准确、全面、深入的财经新闻产品。财新智库是财新传媒通过孵化另行建立的高端金融资讯服务平台,旨在通过发展金融数据业务,壮大宏观经济研究队伍,服务于智库业务客户。详细信息,敬请浏览 www.caixin.com。
关于BBD
BBD(数联铭品)是行业领先的大数据解决方案提供商,紧密围绕新经济,通过动态尽调、信用评级、风险定价和经济指数四个步骤,BBD提供从微观到宏观的大数据服务。详细信息,敬请浏览:http://www.bbdservice.com。
August 2017MasterCard Caixin BBD China New Economy Index
Overview
In August 2017, the Mastercard Caixin-BBD New Economy Index (NEI) reading came in at 33.3, indicating that the New Economy accounted for 33.3% of overall economic input activities that month, up 1.8 ppts from July and back to March average level, the highest level in the recent year (Chart 1). The rising NEI was due to the increase of capital. New economy is defined as following: 1) human capital intensive, technology intensive and capital light; 2) sustainable rapid growth, and 3) in line with the strategic new industries defined by the government. Please refer to our previous reports (March 2016 and March 2017) for the list of NEI sectors.
Primary Inputs
The NEI includes labor, capital and technology inputs that account for 40%, 35% and 25% of the total weight of the index, respectively. The rise in the August NEI reading came from the increase of capital inputs (Chart 2). Capital investment grew fastest in August, increasing from 32.7 last month to 38.9 this month. Technology input index has relatively wide fluctuations in the recent half year, and went a little bit down in August after a two-month growth. It was 30.2 this month. Labor input was 30.3, the same rate as in July.

Percentage changes in labor, capital and technology inputs were 0, 2.2, and -0.3 ppts, respectively. After accounting for the sum of their weights, the net NEI change was a 1.8 ppts increase from July (Chart 3).

Looking at the sectors, the New IT industry formed the largest proportion of the New Economy Index, contributing 9.8 ppts to NEI. Advanced Equipment Manufacturing came second, the highest rate since 2016, contributing 5.8 ppts. Financial & Legal Services ranked the third, contributing 5.6 ppts in August (Chart 4).

New Economy Employment
In August 2017, the average monthly entry level salary of the New Economy was RMB 9,313 per month, increasing from last month’s level of RMB 9,146 (Chart 5). New Economy wage information is compiled from online websites of career platforms and recruitment services including 51job and Zhaopin, as well as other sites that list job demands.
Hiring in the New Economy sectors accounted for 29.4% of total hiring in August, higher than the previous month’s 29.2%. At the same time, the compensation share of New Economy sectors dropped slightly to 31.1%, which meant the average entry salary level of New Economy remained stable compared to national average entry wage level. The entry level salary premium of the New Economy was 6.0% as compared to economy-wide counterparts, lower from 7.6% in July (Chart 6). In the recent half year, the average salary premium of the New Economy saw a small decline after a three-month stable growth, but still higher than 5.0%.

Decomposition of New Established Enterprises
We use newly-established enterprises data to monitor new enterprises in sub-sectors (Chart 7).

Ranking up sub-sectors (from August 2016 to August 2017) include the following. Construction (No.20 to No.16, 18.1% increase in proportion), Decoration (No.8 to No.7, 1.8% decrease in proportion), Agriculture (No.23 to No.21, 18.2% increase in proportion). Part of traditional investment saw a growth, mainly driven by government. Moreover, some industries with light capital were developing. Culture saw a ranking up to No.8 from No. 25 with a proportional increase of 146.7 ppts, the fastest growth sector in terms of ranking and proportion in August. Consulting saw a ranking up to No.6 from No.9 with a proportional increase of 10.2%. Information saw a ranking up to No.11 from No.12 with a proportional increase of 1.2%. IT saw a ranking up to No.9 from No.11 with a proportional increase of 9.2%.
Ranking down sub-sectors (from August 2016 to August 2017) include the following. Investment (No.16 to No.25, 28.2% decrease in proportion, the largest drop this month), E-commerce (No.7 to No.14, 48.7% decrease in proportion), Education (No.6 to No.13, 43.1% decrease in proportion), Communication (No.17 to No.19, 5.7% decrease in proportion), Media (No.22 to No.23, 7.0% decrease in proportion), Labor (No.21 to No.22, 10% decrease in proportion). Also, the ranking of Real Estate and Materials went down, both with a proportional decrease of around 16%.
Economic Activities Based on Major Airport Traffic
This month, we explore airports traffic data and compare passengers inflow of major airport in August 2017 and August 2016.
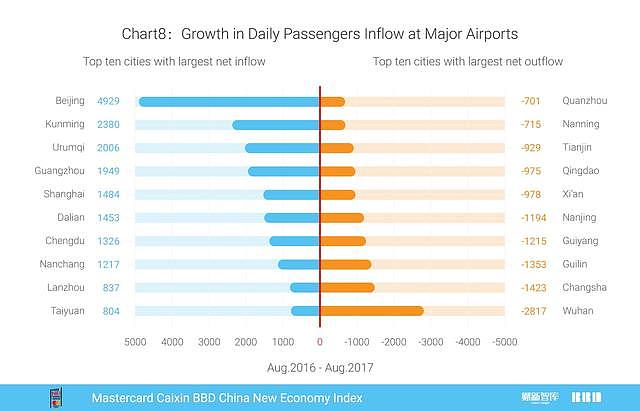
We calculate the changes of daily net passengers inflow average by subtracting daily net passengers inflow average in Aug16 from that in Aug17. Based on this methodology, cities with the fastest increases in net inflows are Beijing, Kunming, Urumqi, Guangzhou and Shanghai, whose prosperous economy keeps attracting people (Chart 8). Urumqi ranked number 3rd in August, showing its increasing capacity in attracting people. Southwestern cities like Chengdu and Kunming kept strong ability in attracting people since 2016. Shenzhen still falled out of the top list.
Cities with the fastest decreases in net inflows are Wuhan, Changsha, Guilin, Guiyang and Nanjing. This shows the attractiveness of these cities went down during the past year.
Recovery in Investment Based on Employment Data
We use monthly completed investment in real estate development and demand for construction employees to analyze the current state of investment (Chart 9). The demand for construction employees and completed investment in real estate development showed a similar trend. They synchronized in most times, although diverging in July. In July 2017, ratio of demand for contruction employees reached 8.49%, an increase by 0.59% from 7.90% in June. At the same time, the completed investment in real estate development in July was RMB 915.1 billion, a decrease from RMB 1301.5 billion in June, or a 29.7% MoM decrease.
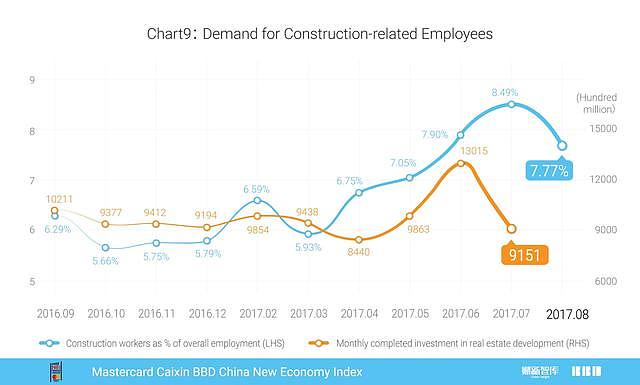
This month starts seeing a decrease in demand for construction employees, reaching the level at 7.77%, with a 0.72% MoM decrease. Given the historical accuracy of the index, we predict that real estate investment decreases next month.
City Rankings of the New Economy
Based on overall New Economy rankings, the top twenty cities are shown in Chart 10. The top five cities are Shanghai, Guangzhou, Hangzhou, Beijing and Nanjing. Rankings are based on a weighted average of the percentile rank of indicators for the city in the past 6 months.

Chart 11 showed the average NEI city rankings between February 2017 and August 2017. The top five cities are Beijing, Shanghai, Hangzhou, Guangzhou and Nanjing.

For further information please contact:
MasterCard
Mr. Wu Huanyu, Vice President of Public Relations
Tel:+86-10-8519-9304
Email:[email protected]
Caixin Insight Group
Dr. Wang Zhe, Senior Economist
Tel:+86-10-8590-5019
Emails:[email protected]
Ma Ling, Public Relations
Tel:+86-10-8590-5204
Email:[email protected]
BBD
Dr. Chen Qin, Chief Economist
Tel:+86-28-6529-0823
Emails:[email protected]
The MasterCard Caixin BBD China New Economy Index is the fruit of a research partnership between Caixin Insight Group and BBD, in collaboration with the National Development School, Peking University. The subject of a year of research, the NEI was first publically released on March 2, 2016 and will be issued the 2nd of every month at 10:00am China Standard Time.
About Caixin
Caixin Media is China's leading media group dedicated to providing financial and business news through periodicals, online content, mobile applications, conferences, books and TV/video programs. Caixin Media aims to blaze a trail that helps traditional media prosper in the new media age through integrated multimedia platforms. Caixin Insight Group is a high-end financial data and analysis platform. For more information, please visit www.caixin.com.
About MasterCard
MasterCard (NYSE: MA), www.mastercard.com, is a technology company in the global payments industry. We operate the world’s fastest payments processing network, connecting consumers, financial institutions, merchants, governments and businesses in more than 210 countries and territories. MasterCard’s products and solutions make everyday commerce activities – such as shopping, traveling, running a business and managing finances – easier, more secure and more efficient for everyone. Follow us on Twitter @MasterCardAP and @MasterCardNews, join the discussion on the Beyond the Transaction Blog and subscribe for the latest news on the Engagement Bureau.


 +61
+61 +86
+86 +886
+886 +852
+852 +853
+853 +64
+64